Build a budget app dashboard
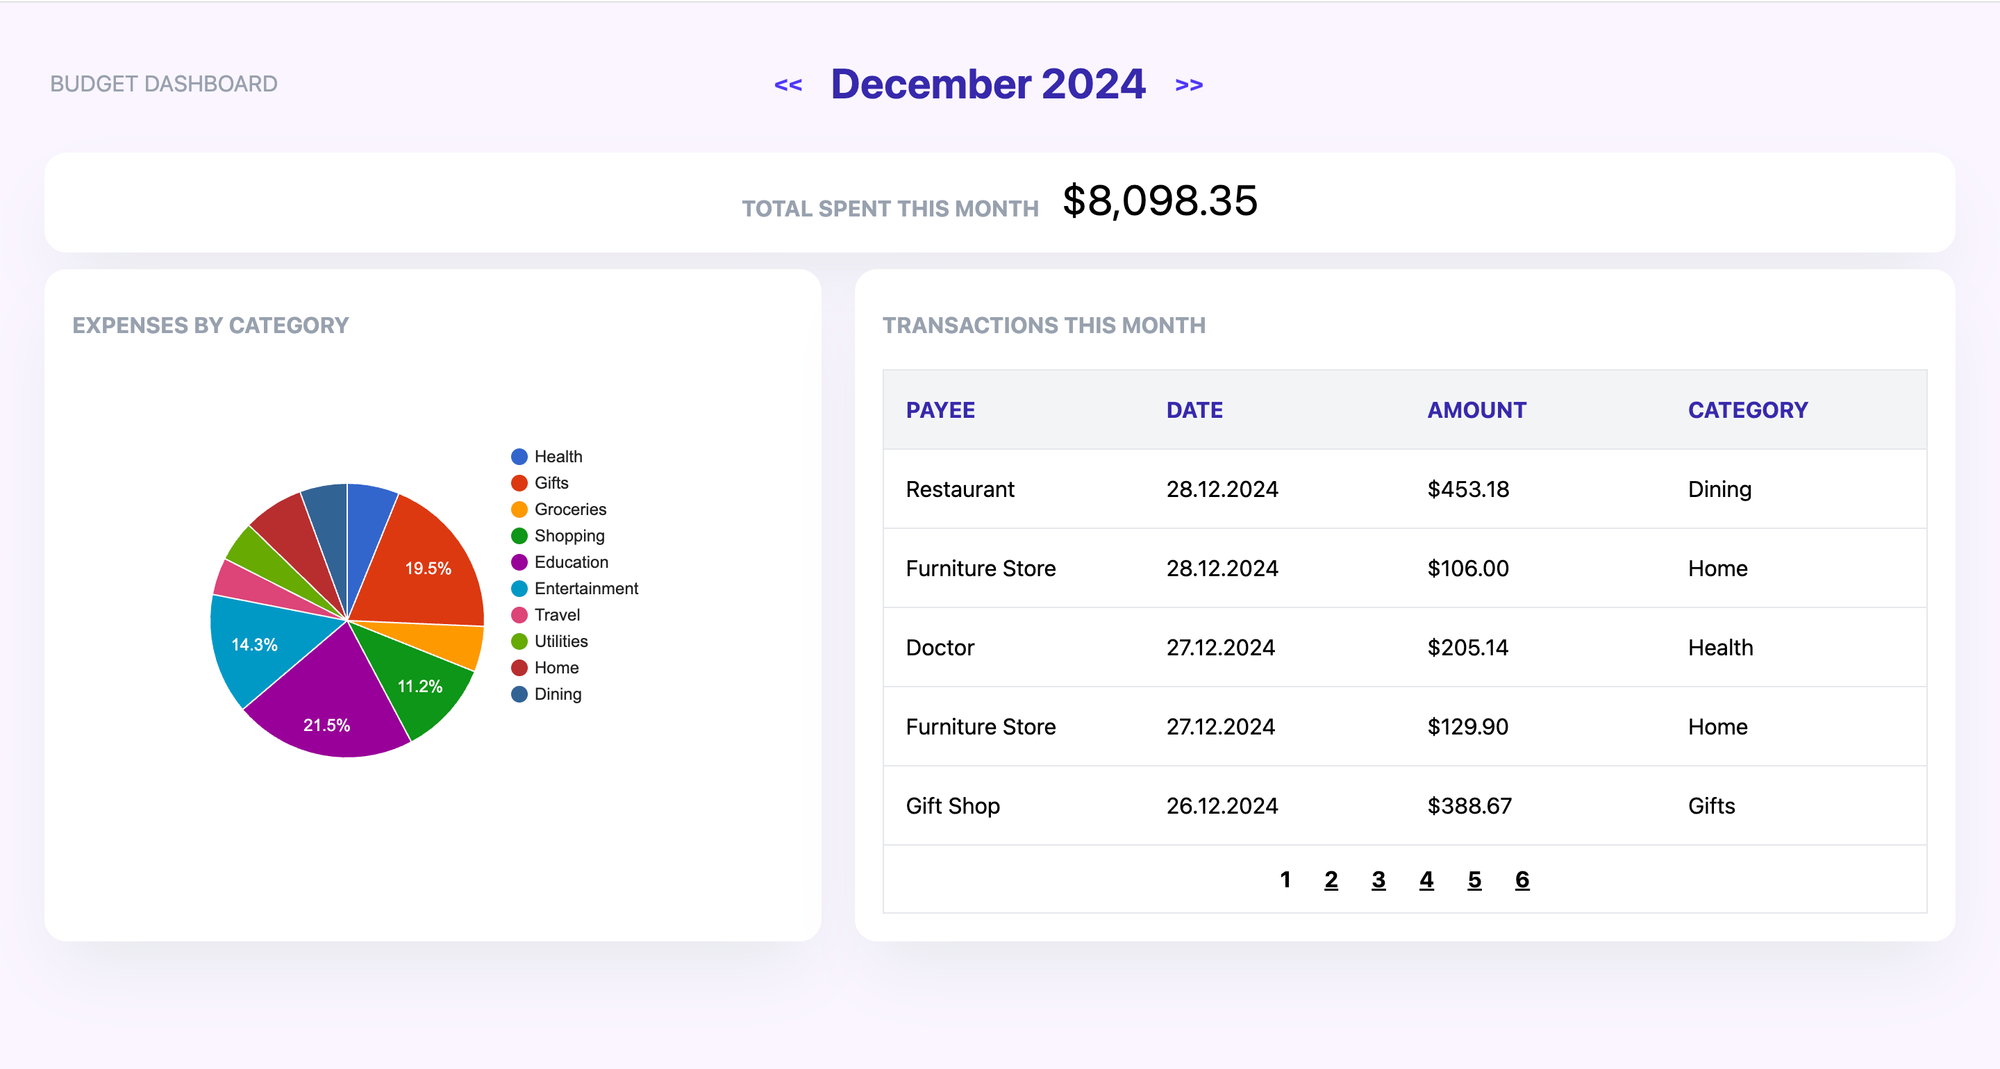
Build a dashboard for an expense tracking app.
For a given month, it should show:
- the transactions for that month
- the total spent amount
- a graph of expenditure per category as a pie chart
Users should be able to navigate through the months.
Show the transactions 5 at a time, with the most recent ones first.
Since the focus is on the client-side React interactivity, this app has no backend - you can just use the sample JSON file provided for the data.
For each transaction, the date, payee, amount and category are available.
For displaying the chart, you can use React Google Charts library, which has a simple to use pie chart.
Here is how the completed component should be used:
import data from './transactions.json';

<BudgetDashboard transactions={data} />
Good luck! 🍀
💡
Ready to check your work?
Become a member and get access to the official solution and the comments section for feedback and discussion.
Become a member and get access to the official solution and the comments section for feedback and discussion.
Member discussion